Introduction to Plotting with Tablesaw
From the beginning, Tablesaw supported plots for quick, basic, exploratory data analysis. It served its purpose, but fell far short of what the best visualization tools provide. Unfortunately, none of those tools are written in Java.
With version 0.2.0 we introduced a new plotting framework, which provides a Java wrapper around the Plot.ly open source JavaScript visualization library. Plot.ly is based on the extraordinary D3 (Data-Driven Documents) framework, and is certainly among the best open-source visualization packages available in any language. Plot.ly is so good, it has become widely used in languages other than JavaScript such as Python and R, which already had solid options for visualization.
We’ve taken a similar approach to these other languages, providing a wrapper that makes it easy to construct plots in pure Java, And while you can create plots from standard Java objects and primitives, we’ve also ensured that you can build them directly from Tablesaw tables and columns.
This is a huge step forward for Tablesaw in many ways as high quality visualization tools are essential in analytical effort. These are some of the most important benefits:
- Plot.ly supports a huge range of visualization types. Tablesaw already supports many kinds, including time-series plots, histograms, 2D histograms, box plots, line charts, area charts, scatter plots, 3D scatterplots, bubble plots, Pareto charts, pie charts, and bar charts.
- We support numerous variations on the plots. For bar charts, for example, we support vertical and horizontal, one-variable, and grouped or stacked charts.
- We are continually adding support for many additional types, including geographic maps, tree-plots, network diagrams, heat maps, dedograms, distplots, 3D surfaces, 3D ribbons, wind-rose charts, tertiary plots, 2D density plots, contour plots, tree-maps, violin plots, scatterplot matrices, etc.
- We provide a single, consistent Java API for constructing these plots using builders, type safe enums, and other Java features to minimize the spelling and other issues that are common in working with JavaScript-based tools.
- The plots have a single, consistent, and professional appearance.
- Each chart is interactive. They render with a common family of interactive tools for saving, printing, panning, zooming, selecting points, etc.
- The range of supported customizations is enormous, including, fonts, legends, custom axis, spikes, hover effects, and so on. You can almost always get the visualization you want.
- And, of course, you can use the output in a Web page when you’re ready to share your visualizations with the wider world.
Please be aware that we don’t support the entire plot.ly API. We do, however, support a large and growing portion.
How it works
There are two ways to work with plotting. You can use the predefined “canned” plots in the api package, or you can roll-your-own custom visualizations.
Pre-defined (“Canned”) plots
The api package contains simplified interfaces for producing a number of common plot types. The goal for these plots is that they can be created and displayed in one or two lines of code. Here’s an example bubble plot:
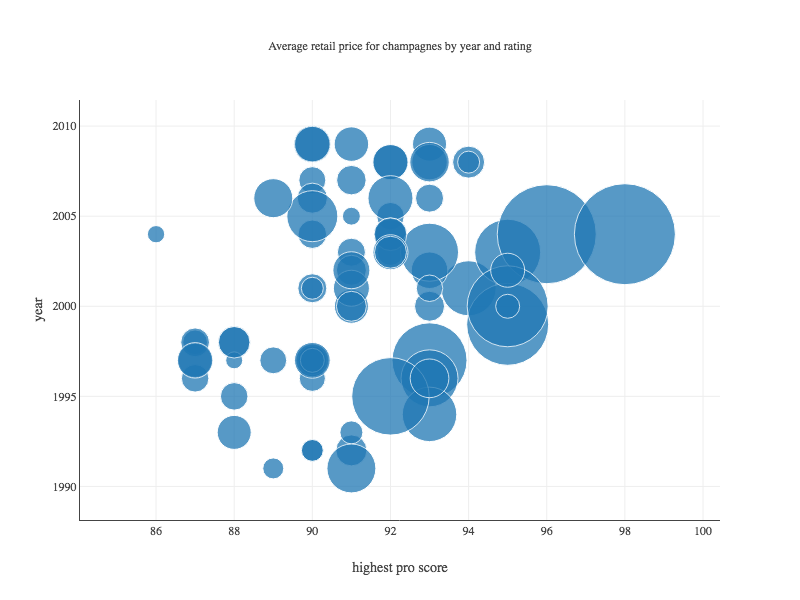
And here’s the code to create and display it. In the simple API, rendering a bubble plot requires two steps. First, a call to BubblePlot.create() returns a Figure object, and then the figure is rendered by passing it to a Plot.show() method.
Finding Example Code
You can find example code for all kinds of plots in the test folder of the jsplot project. The code for this specific plot is in the class BubbleExample2:
https://github.com/jtablesaw/tablesaw/tree/master/jsplot/src/test/java/tech/tablesaw/examples/BubbleExample2.java
This writes a generated HTML page containing the necessary JavaScript to a file on the local filesystem, and opens it in a browser window.
Custom visualizations
Custom visualizations are assembled using “figures”, “traces”, and “layouts”. Custom visualizations are described here.
Ways of working
Visualizing data while working in your IDE
When you’re doing data analysis, it’s important to be able to create plots easily in your IDE, so we provide a way to render plots without a servlet engine or web server. To do that, we write an output HTML file to disk and use the default browser on the desktop to load it . The effect is similar to testing Web apps from within an IDE. This is what the call to Plot.show() in the example does
Rendering output to a Web page
You can render plots to web pages easily by getting the JavaScript from figure you want to display. All figures, traces, and layouts implement asJavaScript() which returns a String.
Rendering output in a Java UI
Unfortunately, this isn’t as easy to do as it should be. The JavaFx WebView component is ok for very simple pages, but is too fragile handling JavaScript and CSS-heavy pages for us to support. There are a few other browser components available commercially or as open source if you need to use Tablesaw’s visualization tools, but you may be better off with JavaFx Charts or another pure Java library.
For more information
See Tablesaw and the Tablesaw User Guide for more information.