Histograms and Box Plots
Understanding the distribution of data within a column is often essential. Tablesaw provides one and two dimensional histograms, as well as box plots.
The complete code for this example can be found here: https://github.com/jtablesaw/tablesaw/blob/master/jsplot/src/test/java/tech/tablesaw/examples/DistributionVisualizations.java
We start by loading the data we’ll use in our examples below.
Table property = Table.read().csv("sacremento_real_estate_transactions.csv");
Histograms
A one dimensional histogram of property prices is shown below.

This plot shows the distribution of injury counts for the most powerful tornadoes. To produce it, we simply filter the table to include only level 5, and call Histogram.create();
Plot.show(Histogram.create("Distribution of prices", property, "price"));
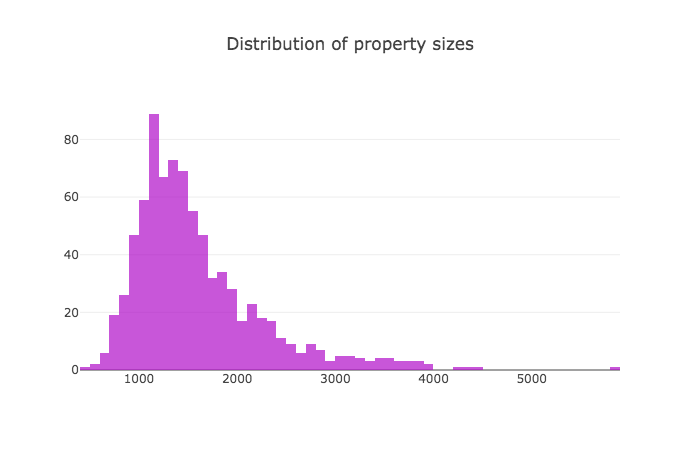
We also take a histogram of sizes, after setting any sizes of 0 square feet to “missing”.
NumberColumn sqft = property.numberColumn("sq__ft");
sqft.set(sqft.isEqualTo(0), DoubleColumnType.missingValueIndicator());

Plot.show(Histogram.create("Distribution of property sizes", property, "sq__ft"));
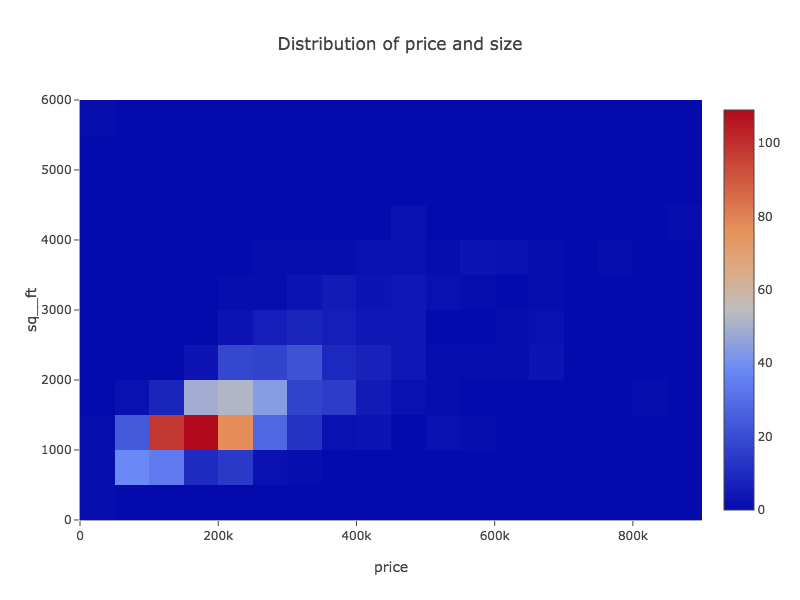
2D Histograms
It may be useful to look at the relationship of two distributions. Ysou can do that with a 2D Histogram.
Plot.show(
    Histogram2D.create("Distribution of price and size", property, "price", "sq__ft"));
Box plots: Comparing the distributions of sub-groups
Comparing distributions of sub-groups is also really useful. The box plot is ideal for that:
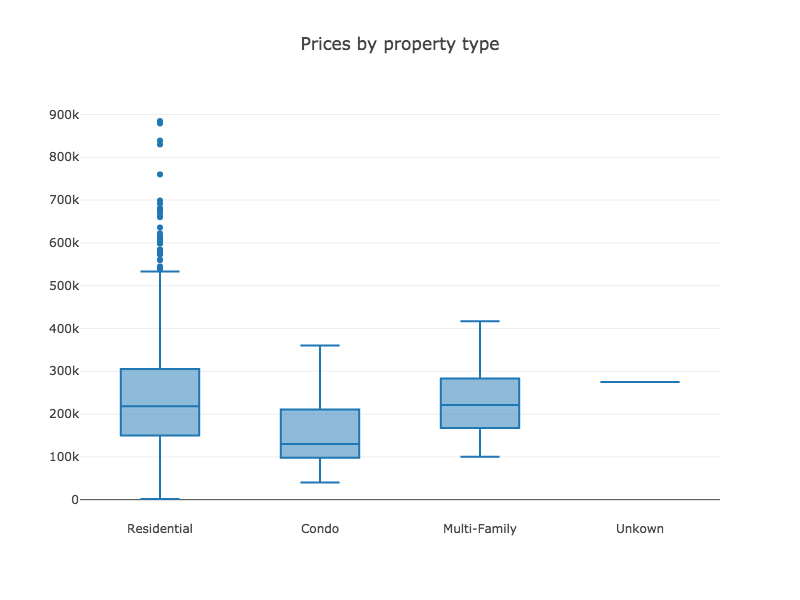
And here’s the code:
Plot.show(BoxPlot.create("Prices by property type", property, "type", "price"));